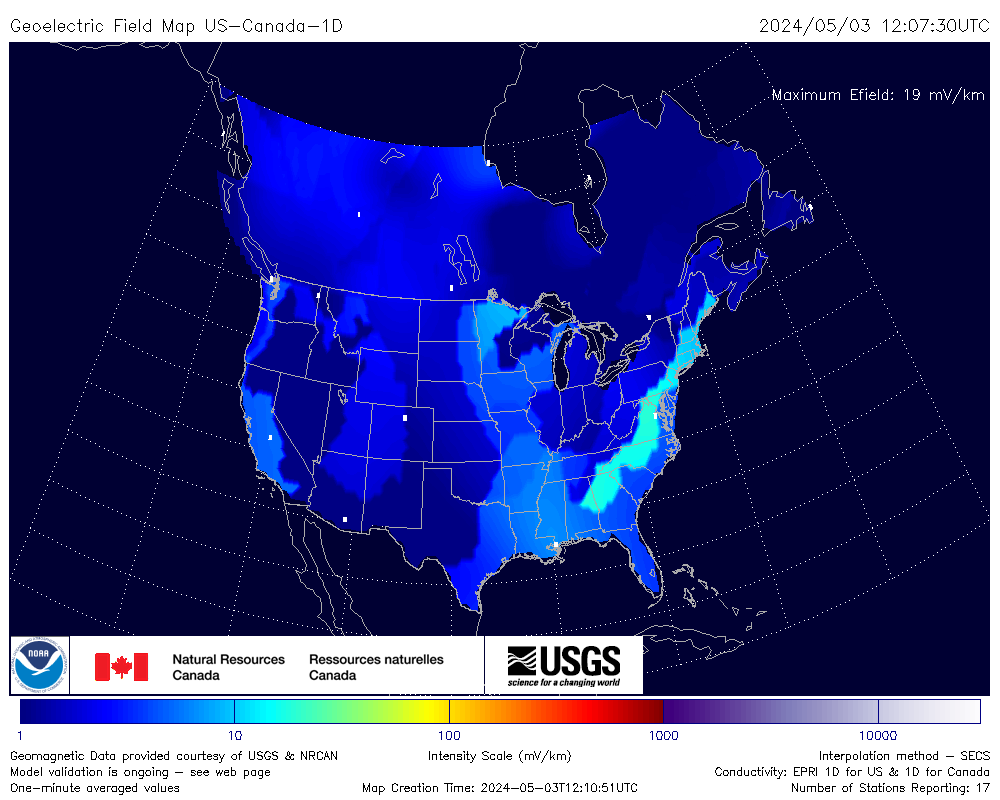
The geoelectric field is the electric field induced in the ground by changing magnetic fields during geomagnetic storms. It is measured in millivolts per kilometre (mV/km).
The 3D model covers only the continental US, where survey data exists, and NOAA recommends it there. The 1D model covers more area, including Canada.
NOAA says these maps still need validation, and advises caution before using them for operational decisions.
Source: NOAA Space Weather Prediction Center, with USGS, Natural Resources Canada and NASA/CCMC. Informational only. Kp index and forecast: NOAA SWPC.
Geoelectric field map today: what it shows and how to read it
The geoelectric field map above is NOAA's live estimate of the electric fields that geomagnetic storms induce in the ground across the US and Canada. It is the closest thing to a storm hazard map for the power grid, and this guide explains what it measures, how to read it and what its limits are.
Updated .
The short answer
During a geomagnetic storm, the changing magnetic field at Earth's surface induces electric fields in the ground, measured in millivolts per kilometre (mV/km). These fields can drive currents through long conductors such as power lines and pipelines. The map shows the estimated field right now, using live magnetometer readings. It is a model estimate, not a measurement, and it does not predict power outages.
A geomagnetic storm is a disturbance of Earth's magnetic field, the same event that produces the northern lights. When the magnetic field changes quickly, it induces an electric field in the ground by electromagnetic induction. That ground-level electric field is the geoelectric field, and it is usually quoted in millivolts per kilometre.
The field matters because it can push electric current through any long conducting path that touches the ground at two distant points. These are called geomagnetically induced currents (GIC). NOAA describes the geoelectric field as a direct indicator of how space weather affects the power grid and other ground-level artificial conducting pathways.
Why geoelectric fields matter for power grids and pipelines
Power lines, pipelines and railway circuits are long conductors. Induced currents can flow along them and into equipment connected to the ground. In a power grid, this extra direct-current-like flow can overheat transformers and strain voltage control, which is why grid operators watch space weather.
The best-known example is the March 1989 storm, which collapsed the Hydro-Québec grid within about 90 seconds and left roughly six million people without power for around nine hours. Events that serious are rare, and modern operators plan for them, but the risk is the reason NOAA publishes this product. The power industry identified local geoelectric field specification as a critical need at NOAA's 2011 space weather workshop.
For most people a storm makes no difference at home. The map is mainly a situational awareness tool, and it is a useful way to see space weather affecting the ground in real time.
How to read the geoelectric field map
Units. The map shows the estimated field in millivolts per kilometre. Higher values mean a stronger induced field. Use the legend printed on the map for the exact color scale.
Hot spots. Fields are not uniform. Bright patches show where the estimate is strongest at that moment, and they can move and change within minutes.
One-minute updates. NOAA updates the maps every minute using live magnetometer data, so a spike can appear and fade quickly. The widget checks for a new map each minute.
Quiet maps are normal. Between storms the map is mostly calm. Do not expect strong fields on a quiet day.
The storm status. The Kp index and G-scale level at the top of the widget give general storm context. They do not replace the map, which shows where the effect is happening.
The two models: US and Canada (1D) and continental US (3D)
NOAA's Space Weather Prediction Center runs two models of the geoelectric field, and the widget shows both. They use the same live magnetic data but different descriptions of how the ground conducts electricity.
The two NOAA geoelectric field models
Model
Coverage
How it treats the ground
Best for
US and Canada (1D)
The lower 48 states and Canada up to 60°N, on a half-degree grid
Layered, one-dimensional conductivity models for each region
The widest coverage, including Canada
Continental US (3D)
The continental US where survey data exists
Empirical 3D conductivity from magnetotelluric surveys
Locations in the US it covers, where NOAA recommends it
The 1D model is a joint product of NOAA and Natural Resources Canada, with the US Geological Survey and NASA's Community Coordinated Modeling Center. The 3D model captures how the ground's conductivity varies sideways as well as with depth, which is why NOAA recommends it where it applies. Where the two overlap, comparing them is a useful check.
Why the same storm gives different fields in different places
How fast the magnetic field changes. Induction depends on how quickly the magnetic field changes, not only on how strong the storm is overall. Short, sharp changes can produce stronger fields than a long, steady disturbance.
The ground itself. Ground that conducts poorly, such as resistive rock, tends to produce stronger electric fields for the same magnetic change. This is why local geology matters and why the 3D model exists.
Location. Fields tend to be stronger closer to the auroral zone, but hot spots can appear farther south in strong storms.
The phase of the storm. Fields often peak during rapid events within a storm, not necessarily when the aurora is brightest.
Geoelectric fields, aurora and Kp
The same geomagnetic storm that lights up the sky drives the geoelectric field, so both tend to rise together. But they are not the same thing. Kp is a global index averaged over three hours, while the geoelectric field is a one-minute estimate for a specific place. A moderate Kp can still produce a local hot spot, and a high Kp does not guarantee strong fields everywhere.
It is a model estimate. The map is calculated from magnetometer data and ground conductivity models. It is not a direct measurement of the electric field.
It still needs validation. NOAA states that the maps need validation against geoelectric field or GIC measurements, and it advises caution when using them for operational decisions.
It does not forecast. The map reflects current conditions, not what will happen in the next hour.
It does not predict outages. A strong estimate does not mean the power will fail. The effect on any grid depends on its design, its equipment and how operators respond.
Coverage is limited. The maps cover the US and Canada only, and the 1D model stops at 60°N.
For official space weather alerts, watches and warnings, go to NOAA's Space Weather Prediction Center. This page is for information and education only.